• Training & Performance
    • Start running
    • Beginners
    • Running
    • Running Technique
    • Trainings
    • Offroad
    • Triathlon
    • Reviews
  • Wellness
    • Nutrition
    • Let’s go outdoors
  • Crossroads
    • Culture
    • Lifestyle
    • Playlists
  • Lovers
    • Stories and History
    • Editorials
  • News
  • Podcasts
  • Italiano
Runlovers Runlovers
  • Training & Performance
  • Wellness
  • Crossroads
  • News

Strava Year in Sport 2021

  • 2 minute read

For the past few years it has happened that around mid-December we have all been frantically waiting: no, not for Christmas-what a platitude-but for Strava’s annual Year in Sport report.

If you know what I am talking about, chances are you have already spent the weekend sifting through and sharing your very personal report. If, on the other hand, you don’t know what I’m talking about – okay – brief summary. Every year Strava publishes a beautiful report of the (sports) activities that each of us has recorded on the platform: how many kilometers you rode, how much elevation gain, hours of activity, how many times you picked your nose while cycling, etc. Big data in itself, however, is interesting up to a point; what Strava does (very) well is turn it into simple but high-impact infographics that are immediately understandable and shareable. All with animations that create a coherent and visually intelligent narrative flow.

You can find all this information only in the Strava app, on your home or profile.

What hurts me a little bit is. if you have the premium subscription you have the display of some more specific data, such as the activity with the most elevation gain or other such amenities: it fits, on the other hand the ability to have more in-depth metrics is precisely one of the hooks with which Strava encourages you to abandon the free subscription.

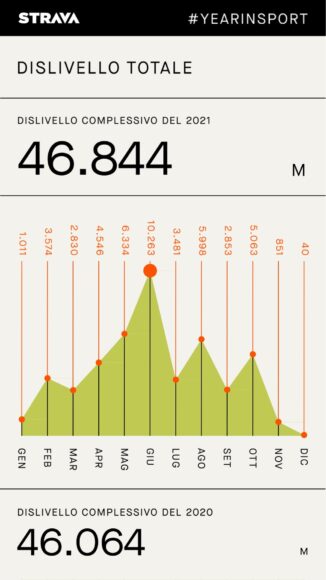
All of this of course feeds our outsized egos, although so much then my mom when she sees that in 2021 I have done 46,844 meters of elevation gain (a good 780 m more than last year) compliments me as much as if I had done 4k or 400k.

The community

But if we step a little bit outside our own backyard we can appreciate instead the global report, that is, the one that covers the data of the whole community and not just our own. In this case, however, the data collected covers the 12 months elapsed from November 1 to October 31 of the following year. Although I’m also quite egoriferous, I have to say that I’m much more fascinated to see how — together — the 95 million Strava users performed.
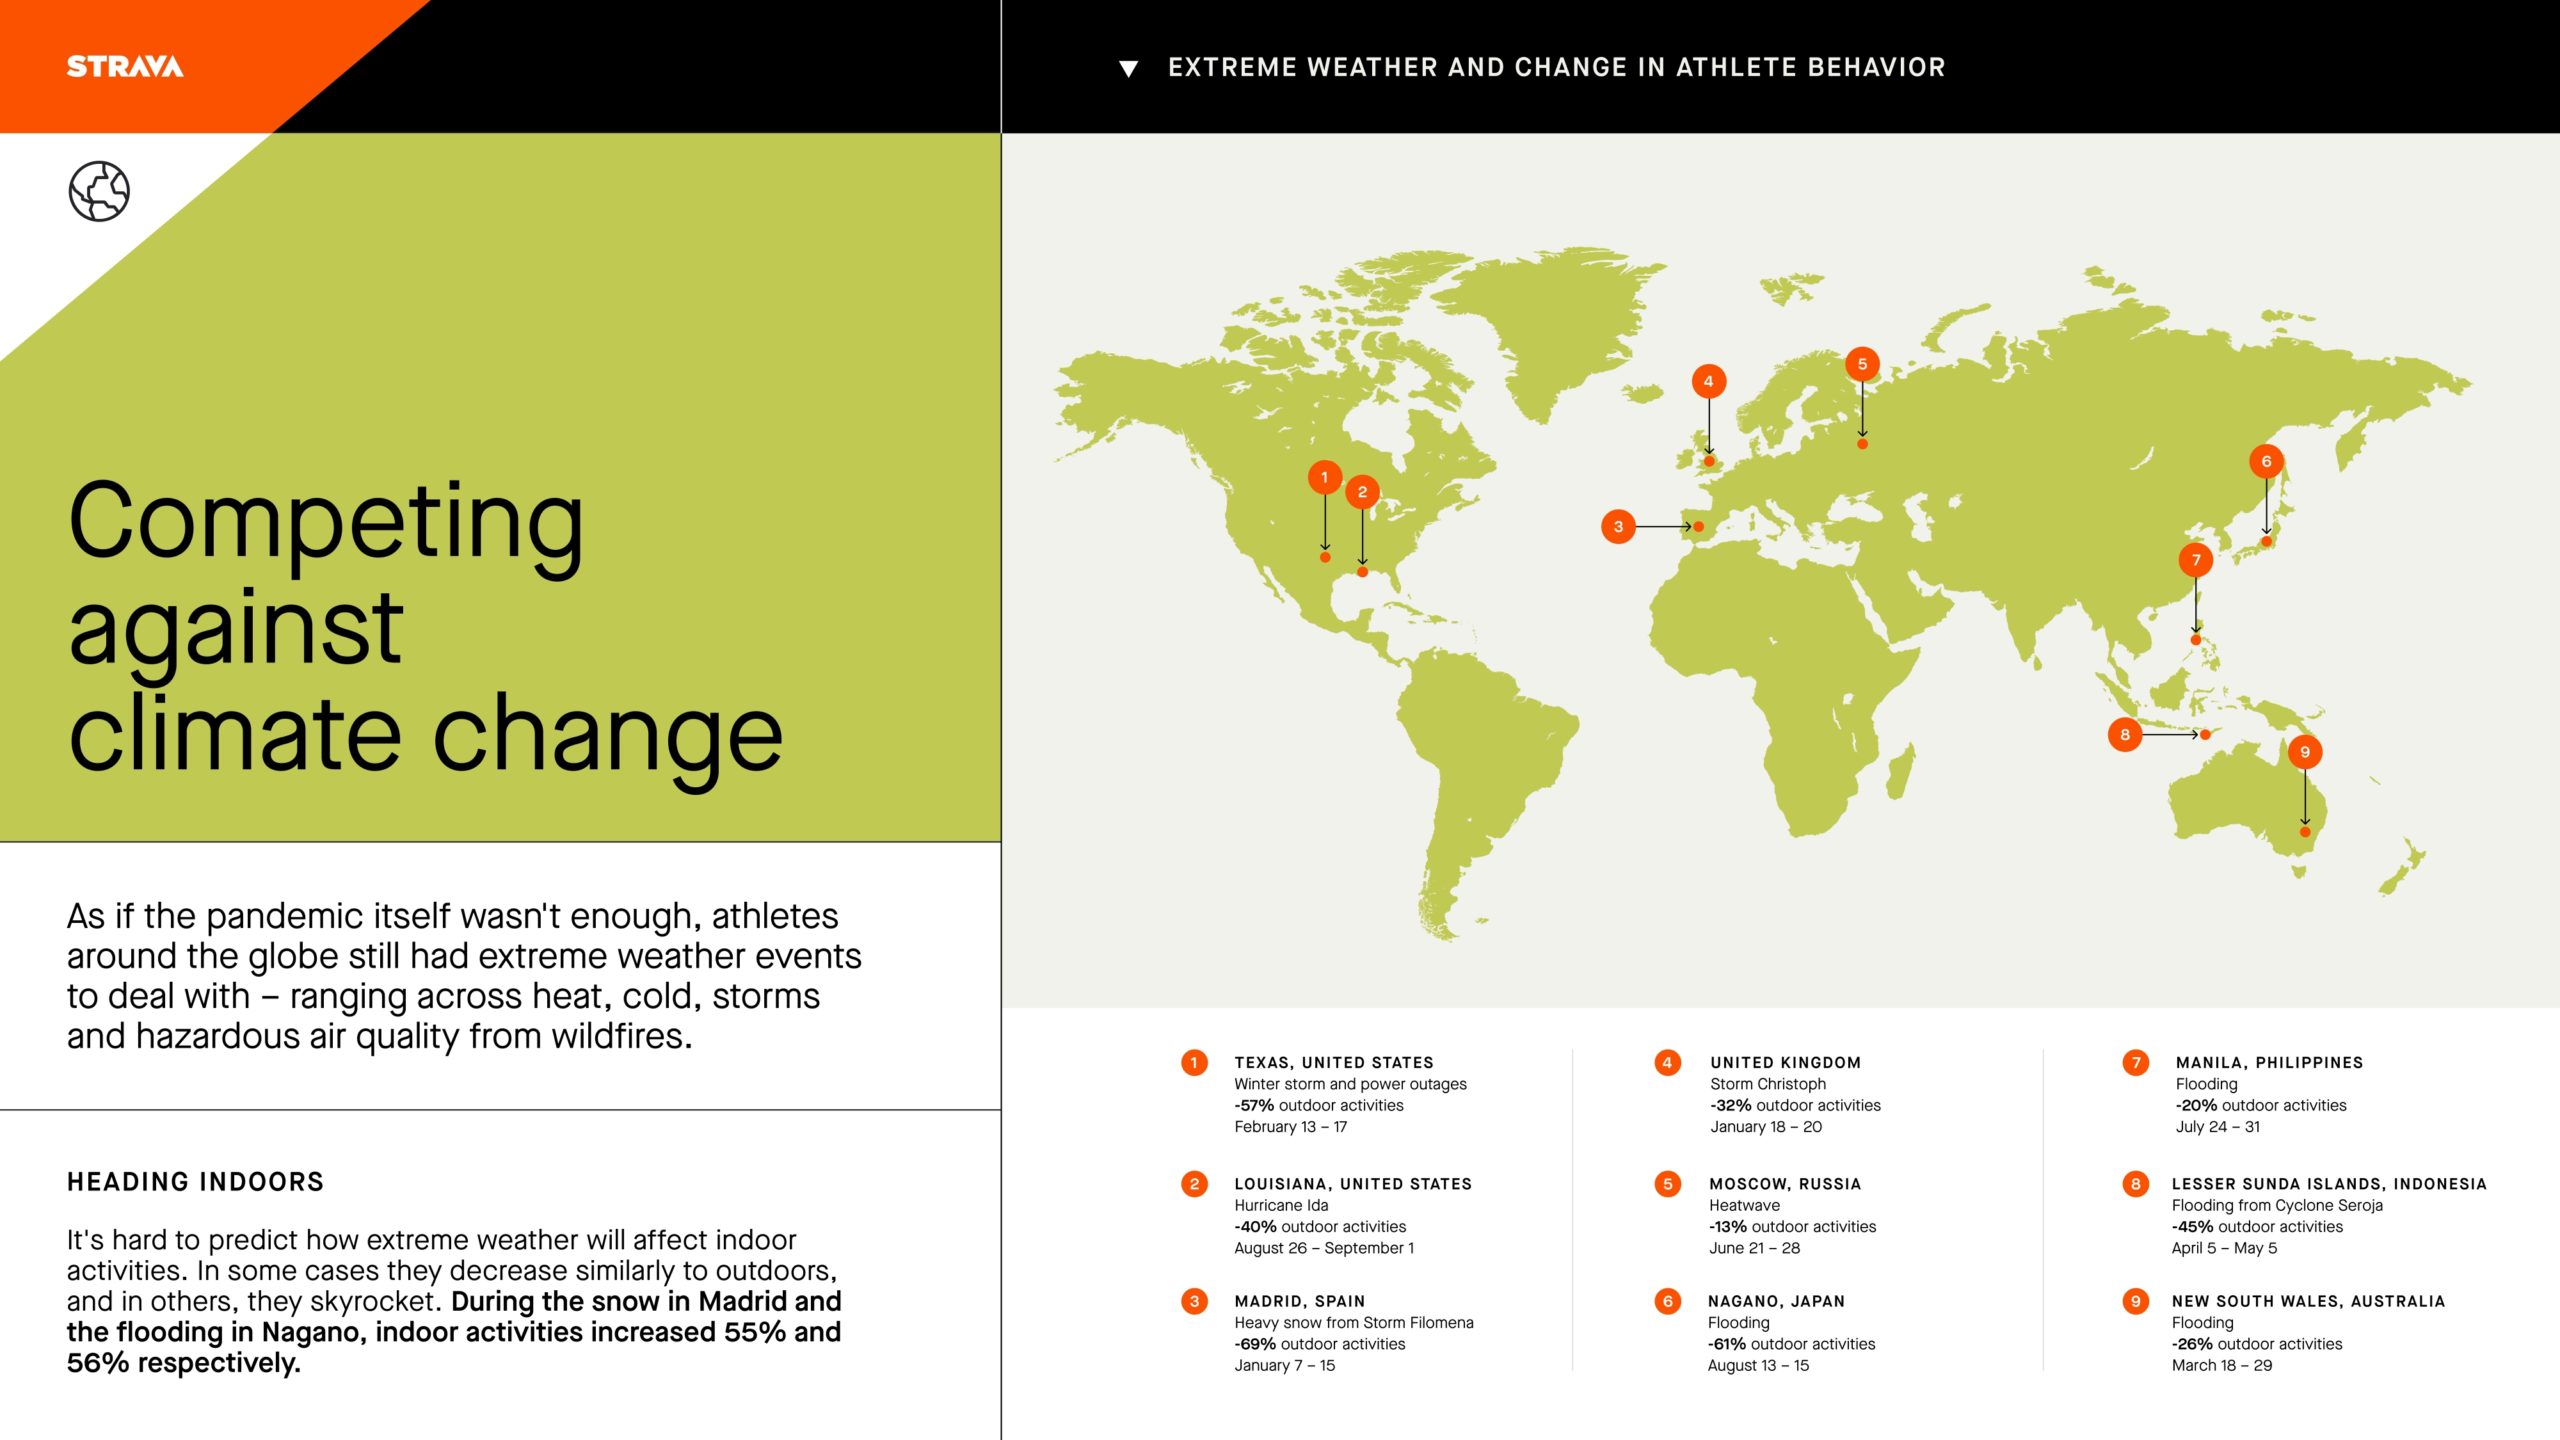
Thus we find that this year we loaded 38 percent more assets than in 2020, or we can see that Americans gave a lot of Kudos to the British, Canadians and Brazilians: they snubbed the French and Spanish instead. Italians not to be found.

If you are a real nerd like me, you can download the pdf with all the available infographics here.

Leave a Reply Cancel reply

Your email address will not be published. Required fields are marked *

This site uses Akismet to reduce spam. Learn how your comment data is processed.

Runlovers
© Runlovers | All rights reserved | Privacy Policy
 
This blog is not a newspaper or journalistic publication, as it is updated with no regular periodic schedule. It therefore cannot be considered an editorial product under Italian Law No. 62 of 2001.

Input your search keywords and press Enter.

Gestisci Consenso
Per fornire le migliori esperienze, utilizziamo tecnologie come i cookie per memorizzare e/o accedere alle informazioni del dispositivo. Il consenso a queste tecnologie ci permetterà di elaborare dati come il comportamento di navigazione o ID unici su questo sito. Non acconsentire o ritirare il consenso può influire negativamente su alcune caratteristiche e funzioni.
Funzionale Always active
L'archiviazione tecnica o l'accesso sono strettamente necessari al fine legittimo di consentire l'uso di un servizio specifico esplicitamente richiesto dall'abbonato o dall'utente, o al solo scopo di effettuare la trasmissione di una comunicazione su una rete di comunicazione elettronica.
Preferenze
L'archiviazione tecnica o l'accesso sono necessari per lo scopo legittimo di memorizzare le preferenze che non sono richieste dall'abbonato o dall'utente.
Statistiche
L'archiviazione tecnica o l'accesso che viene utilizzato esclusivamente per scopi statistici. L'archiviazione tecnica o l'accesso che viene utilizzato esclusivamente per scopi statistici anonimi. Senza un mandato di comparizione, una conformità volontaria da parte del vostro Fornitore di Servizi Internet, o ulteriori registrazioni da parte di terzi, le informazioni memorizzate o recuperate per questo scopo da sole non possono di solito essere utilizzate per l'identificazione.
Marketing
L'archiviazione tecnica o l'accesso sono necessari per creare profili di utenti per inviare pubblicità, o per tracciare l'utente su un sito web o su diversi siti web per scopi di marketing simili.
  • Manage options
  • Manage services
  • Manage {vendor_count} vendors
  • Read more about these purposes
Visualizza le preferenze
  • {title}
  • {title}
  • {title}
Loading Comments...